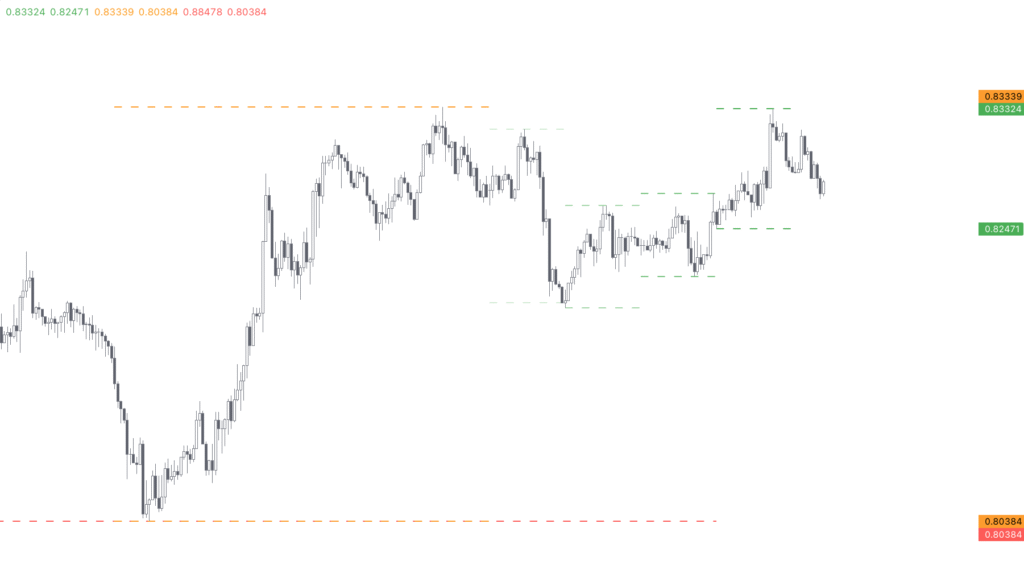
Free Indicators by Sbtnc

Along my journey, I have tailored and crafted my personal trading indicators. You can find my collection of free scripts available open-source on TradingView.

Free Indicators for TradingView

Preview of the "Multi-Timeframe Period Separators" indicator on TradingView chart

Multi-Timeframe Period Separators

Displays period separators for up to four higher timeframes. I specifically crafted this indicator to be fully customizable and designed to work on all symbols.
Preview of the "Tops & Bottoms - Day of Week Report" indicator on TradingView chart

Tops & Bottoms – Day of Week Report

Tracks when the weekly tops and bottoms occur and reports the statistics by the days of the week, which allows traders to make informed decisions.
Preview of the "Tops & Bottoms - Time of Day Report" indicator on TradingView chart

Tops & Bottoms – Time of Day Report

Examines and reports the percentage of occurrence of daily tops and bottoms by the time of the day, which allows traders to make the best decisions.
Preview of the "Time of Day - Volatility Report" indicator on TradingView chart

Time of Day – Volatility Report

Scans the historical volatility by the hours of the day. Discover how the different markets move during the trading day and stay ahead of the competition.
Preview of the "HTF Liquidity Levels" indicator on TradingView chart

HTF Liquidity Levels

Paints an intuitive representation of where liquidity pools are located based on resting orders beyond untapped swing points and behind high timeframe highs and lows.
Preview of the "Bar" indicator on TradingView chart

Bar

Analyzes all bars on the chart to reveal the odds and market behavior over up to two following bars. The indicator organizes the results around retracement, invalidation, continuation, breakout, and state categories.
Preview of the "ATR Daily Levels" indicator on TradingView chart

ATR Daily Levels

Applies the average daily volatility to delimitate how far the market could go today if it goes on the upside or downside. Popularized by Trader Dante, the indicator helps fine-tune your entry, target, stop, and reduce the number of risky trades.
Preview of the "Previous Day Week Highs & Lows" indicator on TradingView chart

Previous Day Week Highs & Lows

An essential indicator that highlights the previous higher timeframe highs and lows on the chart, with particular attention to usability and configurability.
Preview of the "Daily Weekly Monthly Yearly Opens" indicator on TradingView chart

Daily Weekly Monthly Yearly Opens

A must-have in the trader's toolbox, the indicator plots higher timeframe opens on the chart, with special care on usability and configurability.
Preview of the "Chaikin Oscillator" indicator on TradingView chart

Chaikin Oscillator

Plots the original Chaikin Oscillator by famed stock analyst Marc Chaikin, which revolves around Accumulation/Distribution. It adds a special highlight on negative/positive momentum.
Preview of the "Chaikin Money Flow" indicator on TradingView chart

Chaikin Money Flow

Displays the original Chaikin Money Flow by famed stock analyst Marc Chaikin, which measures the Money Flow Volume over a set period. It emphasizes the positive/negative pressure areas.
Preview of the "Multiple Moving Averages" indicator on TradingView chart

Multiple Moving Averages

Wraps up to five fully configurable Moving Averages.
Preview of the "Double Bollinger Bands" indicator on TradingView chart

Double Bollinger Bands

Plots two Bollinger Bands developed by John Bollinger to help identify contraction/expansion of volatility in the market. Adjust the settings to catch squeezes and regressions to the mean.
Scripts
1 +
FOLLOWERS
1 +
BOOSTS
1 +