Premium Indicators by Sbtnc

Amongst all the personal trading indicators that I have developed, you can find my most advanced indicators available for a small fee on TradingView.

Paid Indicators for TradingView

Preview of the "Multi-Timeframe ATR Levels" indicator on TradingView chart

Multi-Timeframe ATR Levels

Applies the average volatility to delimitate how far the market could go over the selected timeframe on the upside or downside. Fine-tune your entry, target, stop, and reduce the number of risky trades. Includes premium features.
Preview of the "ATR Report & Tool" indicator on TradingView chart

ATR Report & Tool

Leverage the price selection tool for calculating the distances in ATR, which can be directly referred to the historical probability table. Factor in the probabilities in your analysis when planning your entry, target, and stop.
Preview of the "Day of Week – Volatility Report" indicator on TradingView chart

Day of Week – Volatility Report

Examines the historical volatility by the days of the week. Discover how the different markets move during the trading week and when to profit.
Preview of the "Day of Month – Volatility Report" indicator on TradingView chart

Day of Month – Volatility Report

Analyzes and reports historical volatility by the days of the month. Learn how volatility evolves over a month across different markets and capitalize on seasonality.
Preview of the "Candlestick Report" indicator on TradingView chart

Candlestick Report

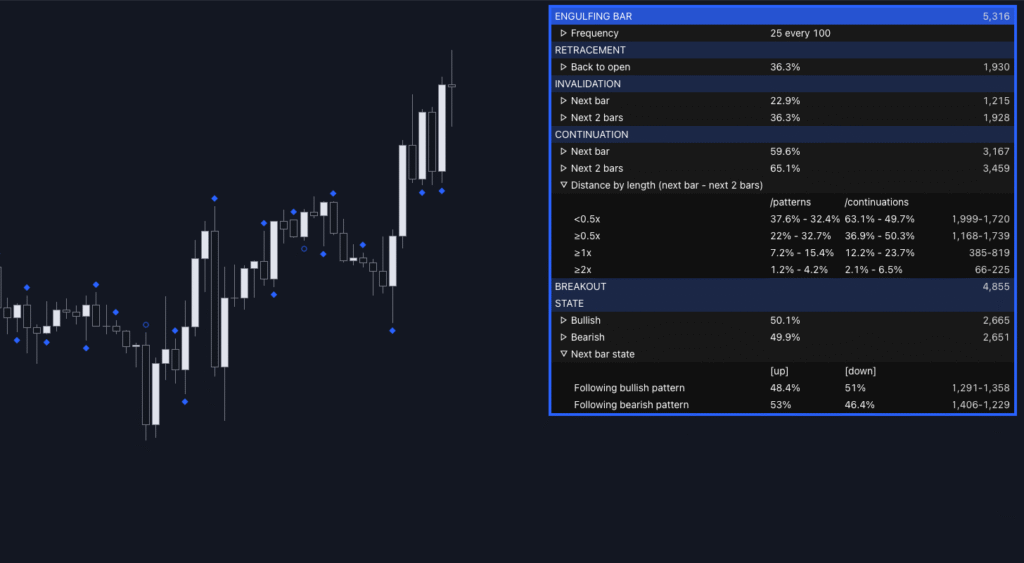
Provides a detailed report on the odds of popular patterns (inside bar, inside bar failure, engulfing bar, outside bar, and variants) and organizes the results around retracement, invalidation, continuation, breakout, and state categories.
Scripts
1 +
FOLLOWERS
1 +
BOOSTS
1 +