Tops & Bottoms – Time of Day Delta
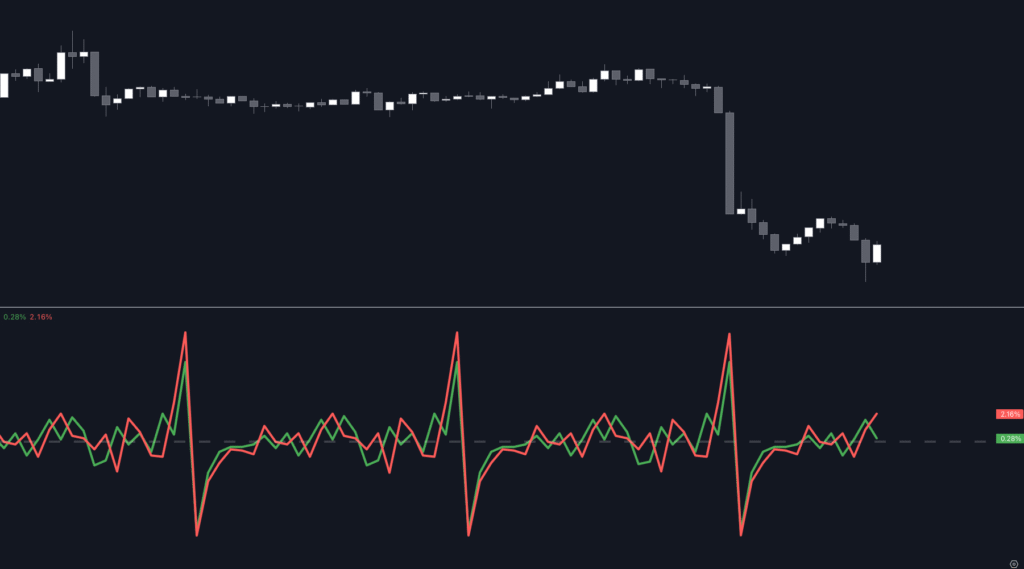
Variant of the Tops & Bottoms – Time of Day Report indicator showing the delta per hour (change %).
Tops & Bottoms – Day of Week Report

Tracks when the weekly tops and bottoms occur and reports the statistics by the days of the week, which allows traders to make informed decisions.
Tops & Bottoms – Time of Day Report

Examines and reports the percentage of occurrence of daily tops and bottoms by the time of the day, which allows traders to make the best decisions.
Day of Month – Volatility Report
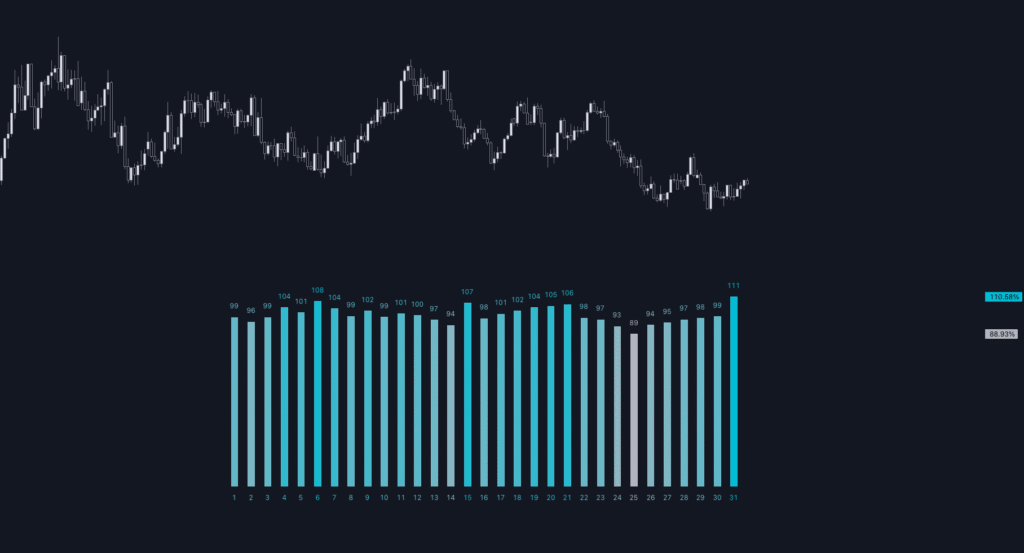
Analyzes and reports historical volatility by the days of the month. Learn how volatility evolves over a month across different markets and capitalize on seasonality.
Day of Week – Volatility Report
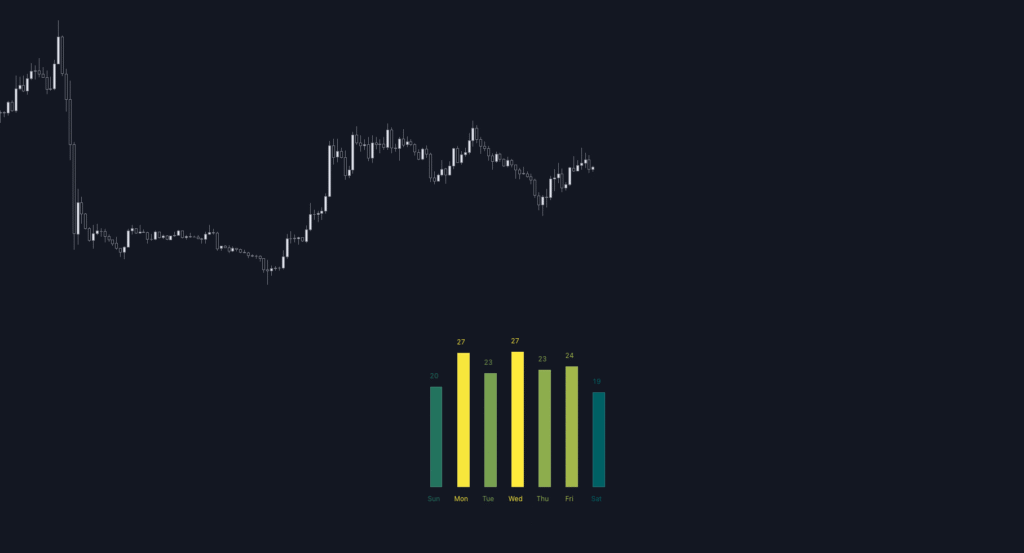
Examines the historical volatility by the days of the week. Discover how the different markets move during the trading week and when to profit.
Time of Day – Volatility Report

Scans the historical volatility by the hours of the day. Discover how the different markets move during the trading day and stay ahead of the competition.
ATR Report & Tool
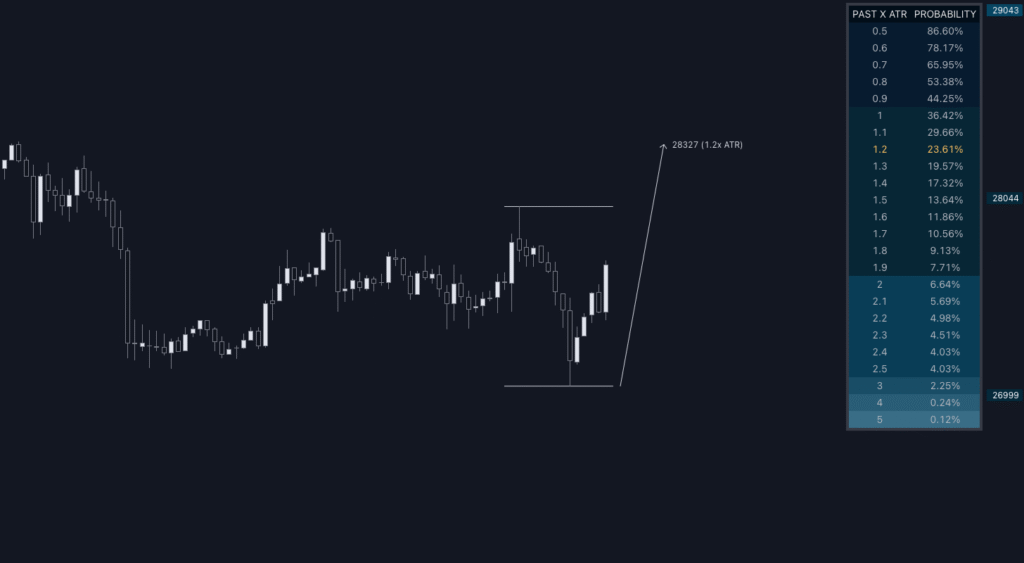
Leverage the price selection tool for calculating the distances in ATR, which can be directly referred to the historical probability table. Factor in the probabilities in your analysis when planning your entry, target, and stop.
Bar

Analyzes all bars on the chart to reveal the odds and market behavior over up to two following bars. The indicator organizes the results around retracement, invalidation, continuation, breakout, and state categories.
Candlestick Report
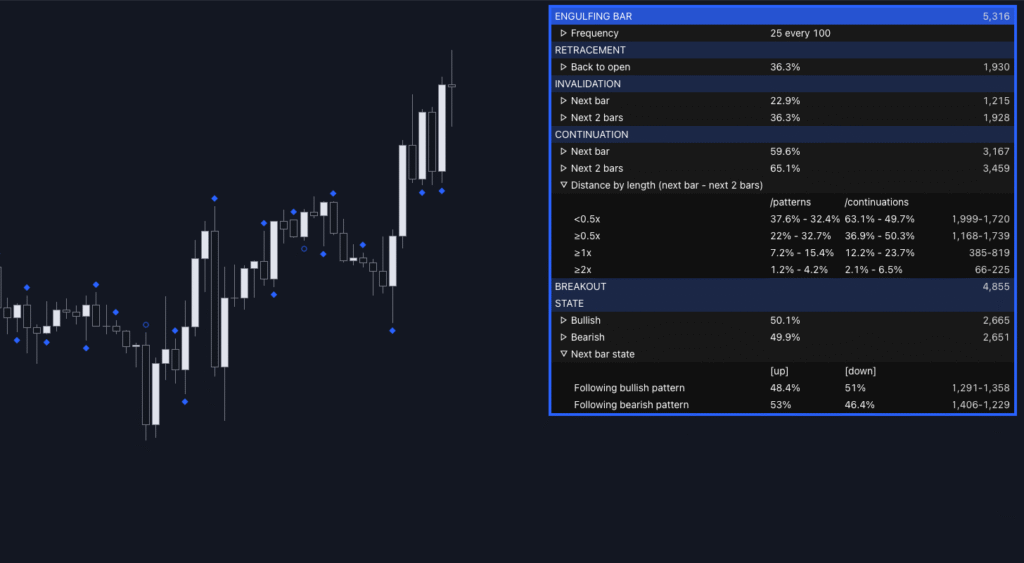
Provides a detailed report on the odds of popular patterns (inside bar, inside bar failure, engulfing bar, outside bar, and variants) and organizes the results around retracement, invalidation, continuation, breakout, and state categories.