Multi-Timeframe ATR Levels

Applies the average volatility to delimitate how far the market could go over the selected timeframe on the upside or downside. Fine-tune your entry, target, stop, and reduce the number of risky trades. Includes premium features.
ATR Daily Levels

Applies the average daily volatility to delimitate how far the market could go today if it goes on the upside or downside. Popularized by Trader Dante, the indicator helps fine-tune your entry, target, stop, and reduce the number of risky trades.
Previous Day Week Highs & Lows
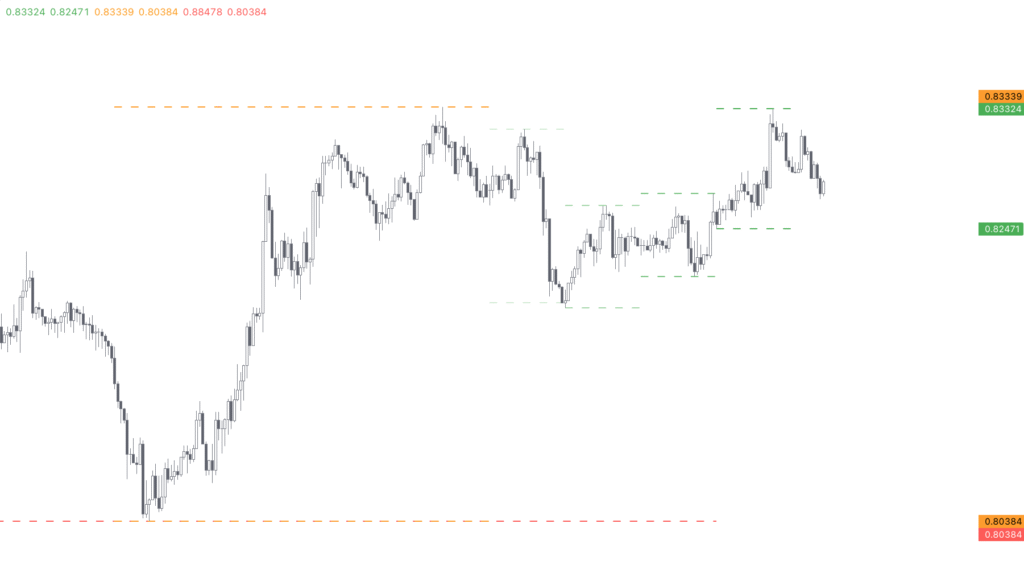
An essential indicator that highlights the previous higher timeframe highs and lows on the chart, with particular attention to usability and configurability.
Daily Weekly Monthly Yearly Opens

A must-have in the trader’s toolbox, the indicator plots higher timeframe opens on the chart, with special care on usability and configurability.
Chaikin Oscillator

Plots the original Chaikin Oscillator by famed stock analyst Marc Chaikin, which revolves around Accumulation/Distribution. It adds a special highlight on negative/positive momentum.
Chaikin Money Flow
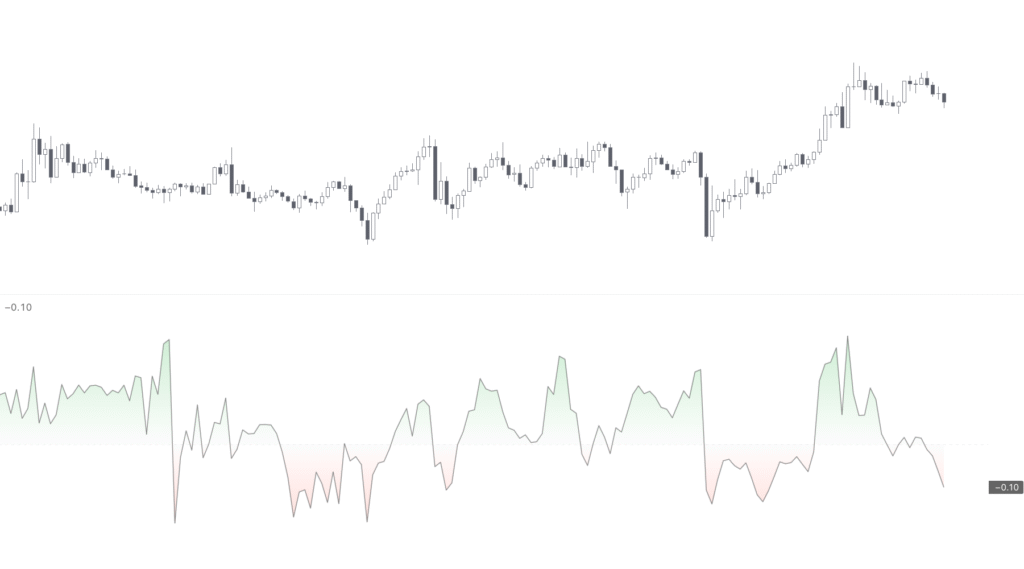
Displays the original Chaikin Money Flow by famed stock analyst Marc Chaikin, which measures the Money Flow Volume over a set period. It emphasizes the positive/negative pressure areas.
Multiple Moving Averages

Wraps up to five fully configurable Moving Averages.
Double Bollinger Bands

Plots two Bollinger Bands developed by John Bollinger to help identify contraction/expansion of volatility in the market. Adjust the settings to catch squeezes and regressions to the mean.