Previous Day Week Highs & Lows v3 + Labels
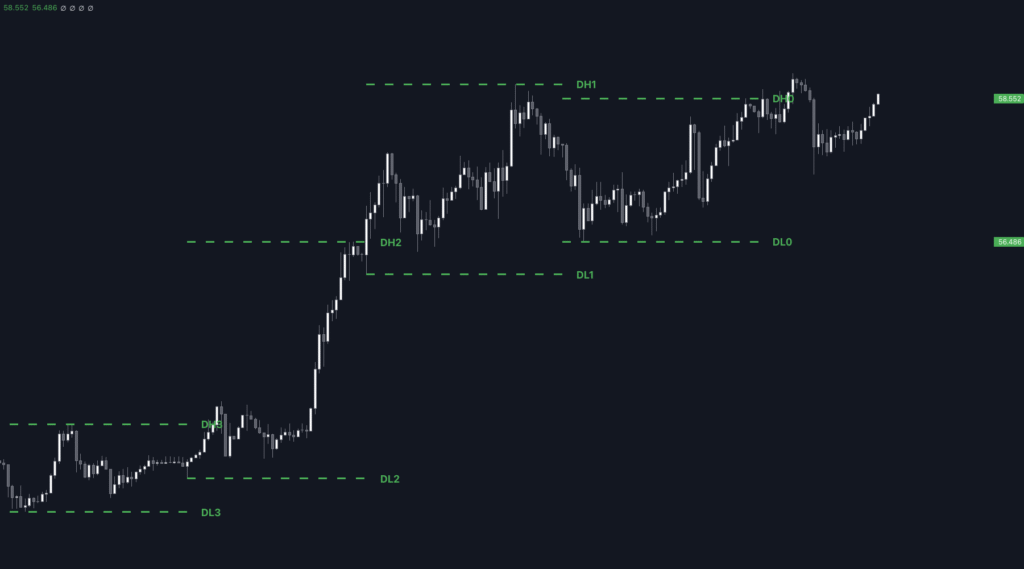
The free Previous Day Week Highs & Lows v3 indicator complemented with labels.
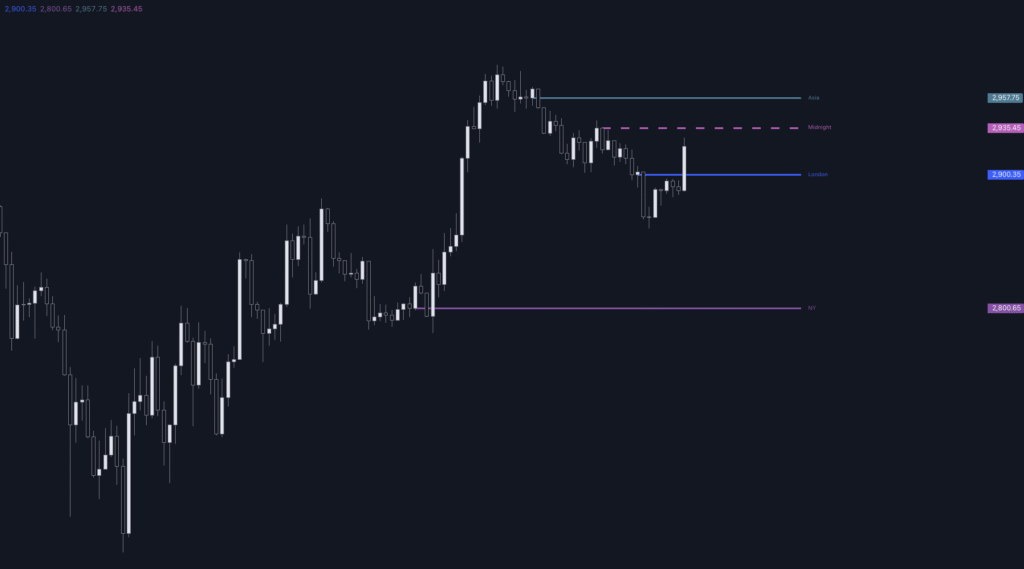
Previous Day Week Highs & Lows v3 + Mids
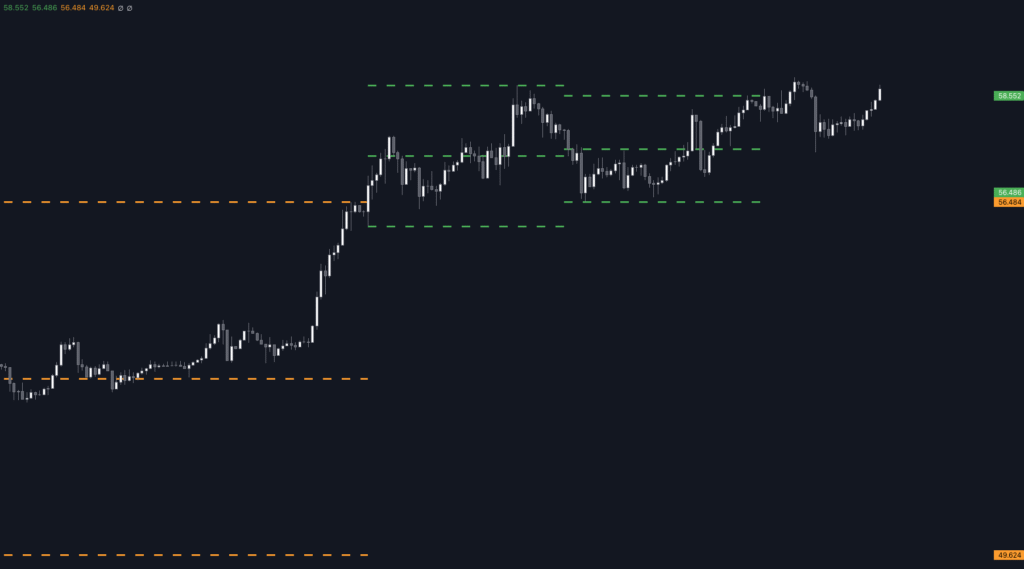
The free Previous Day Week Highs & Lows v3 indicator supplemented with the mid prices feature.
Candlestick Pattern Highlighter
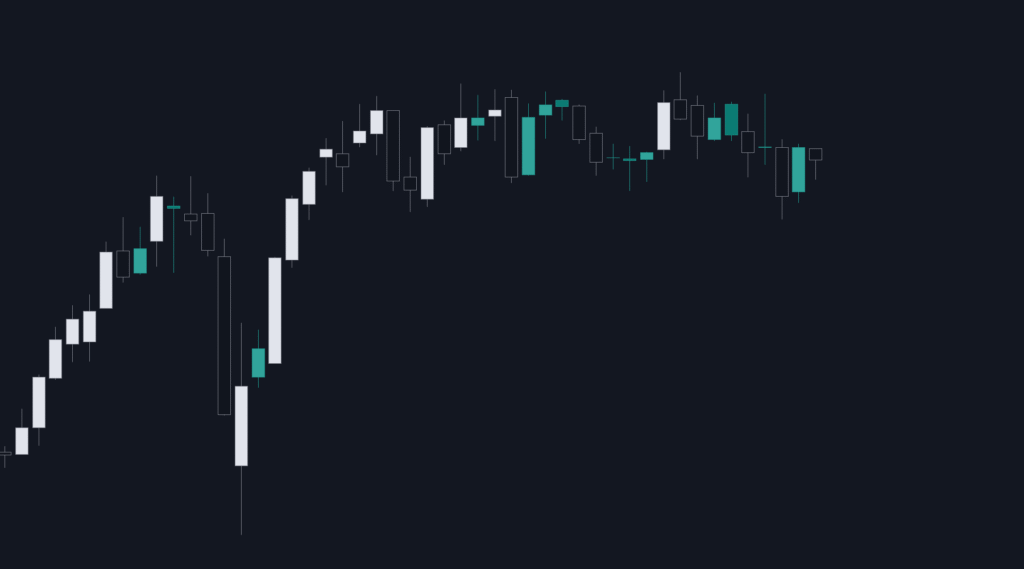
Highlights engulfings, hammers, shooting stars, inside bars (pre-empt), and inside bar failures used as high timeframe biases, as defined by Trader Dante.
Tops & Bottoms – Time of Day Delta
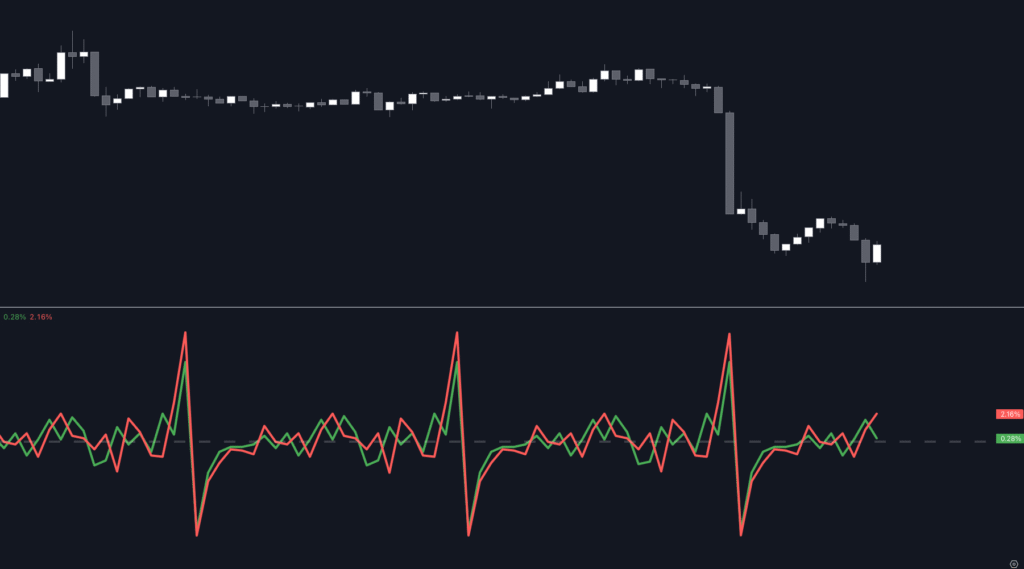
Variant of the Tops & Bottoms – Time of Day Report indicator showing the delta per hour (change %).
MTF ATR Channels
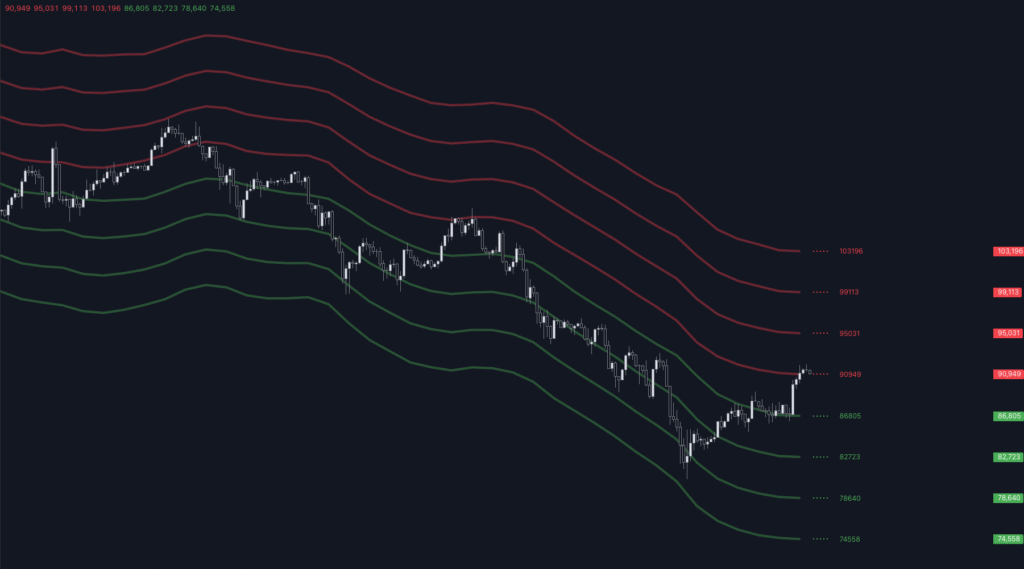
Plots higher timeframes channels enveloping the market based on the ATR applied to the price MA.
Intraday Opens
Displays up to four intraday opens. The sessions and visuals are fully customizable and built for usability.
Multi-Timeframe OHLC Levels

Plots up to five levels from any timeframe independently. Choose between open, previous high, previous low, previous mid, and previous close. The indicator is fully configurable to best adapt to your charting style.
Multi-Timeframe Period Separators

Displays period separators for up to four higher timeframes. I specifically crafted this indicator to be fully customizable and designed to work on all symbols.
HTF Liquidity Levels

Paints an intuitive representation of where liquidity pools are located based on resting orders beyond untapped swing points and behind high timeframe highs and lows.
ATR Report & Tool
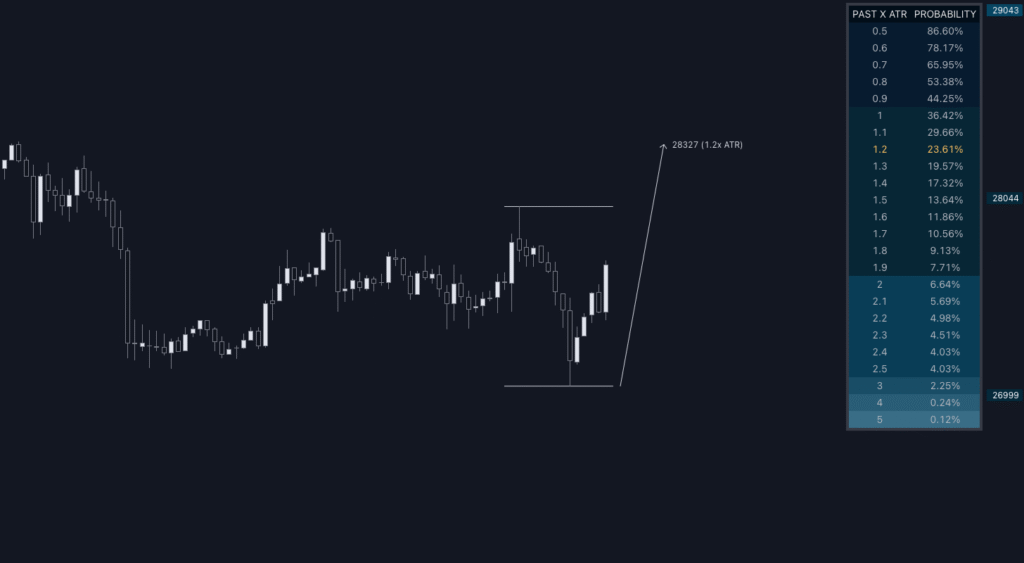
Leverage the price selection tool for calculating the distances in ATR, which can be directly referred to the historical probability table. Factor in the probabilities in your analysis when planning your entry, target, and stop.